Conversion rates – cut the crap / eyes on the prize

Conversion rates are often thrown about as a useful metric. And they are (with the usual caveats). They can provide a helpful indication about whether or not the various bits of your website are doing what they should. Or where there are issues that you need to address.

However I often have conversations with people who are beating themselves up because they are suffering with what they perceive as very low conversion rates. And I’m not sure they’re being all that fair on themselves.

The way that Google Analytics works out your conversion rate is it takes  all your traffic (sessions) unless you tell it otherwise. It then takes the number of completed goals (transactions, or whatever it is you’re getting the conversion rate for) and works out your conversion rate from that.

So, for example if you had 5,000 sessions and 100 transactions then your conversion rate would be 2%. But is this number useful, or accurate? I’d argue it potentially isn’t.

If those 5,000 sessions include visitors who aren’t your target market and were never going to buy anything then they shouldn’t be included in your calculations.

As with so many of the metrics in GA, top level numbers often aren’t that helpful or meaningful.

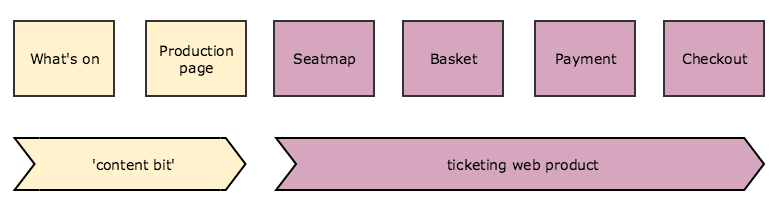
Going back to the example above, what if half of those sessions had come from visitors from overseas who had been following a link to a blog post that cropped up on social media (an unlikely scenario but bear with me). Those visitors are unlikely to ever buy, say, a ticket for a performance so they probably shouldn’t be included in your numbers when you’re looking to calculate whether your production pages are converting traffic. Because that traffic was never going to buy a ticket and didn’t even visit the production pages.

As I’ve mentioned in previous posts (such as this one on funnel analysis and this one on ‘clarity of purpose‘) each part of your digital activity should have a clear purpose, and should be measured on that basis. It’s no use judging your contact page on whether or not it’s good at selling tickets.

This means using custom segments, setting up clear goals, and utilising things like custom dimensions and events if you need to, so that you can accurately measure the effectiveness of your site.

Going back to our example scenario, if your current marketing efforts are aimed at getting people from the city you’re located in, onto your production pages, to buy a ticket, then create a segment that allows you to identify a) if that’s happening, b) to what level that’s happening and how, and c) whether or not it’s meeting the objective you’ve set to the level you need (i.e. buying a ticket). If it is, then great (and you can begin to further optimise your campaign accordingly), if it isn’t then this will at least allow you to begin to identify where the issues may be. You might be getting the right sort of traffic but it’s not converting and through isolating and being able to analyse this traffic you will be able to begin to see where and how users are being tripped up.

Don’t use ‘all traffic’ to work out conversion rates as there will inevitably be ‘irrelevant’ traffic being swept up in this. If a session is landing on the site and hitting pages that play no purpose in the user journey for the goal that you’re analysing the conversion rate for then you’re including traffic that plays no role in the scenario you’re examining. Which isn’t helpful for anyone.

Relying on top level metrics means you’re never going to be able to identify actionable insights. Your website will likely have a number of goals whether that’s newsletter signups, enquiry submissions, donations, membership purchases, account setup, ticket purchases (you get the idea).

Each of those goals should have a clear user journey, ending in the goal being achieved. By properly measuring the goals you can work out if your various user journeys are working as they should be. And whether or not you’re actually enjoying any success.

So, to summarise (as ever, I’ve gone on a bit).

  1. If your conversion rates are looking a bit sad, are you actually being fair on yourself or are you setting your terms of reference to be far too wide?
  2. Use custom segments and goals to identify whether your digital platforms are working as they should be.

Putting the fun in funnel analysis

No, really.

Typically at Substrakt the primary aim for our sites is simple: sell tickets. What a customer sees as an organisation’s website is often comprised of two (or more) separate systems, this can make funnel analysis tricky, and may limit the amount of conversion optimisation you can do.

I have recently been doing some funnel analysis across all of our sites to look at the user journey that supports that primary goal (i.e. the purchase pathway) – initially just to see if there were any noticeable trends or patterns that stuck out. And two things did:

1. Mobile traffic wants to be booking traffic. The amount of mobile traffic that gets 50-75% of the way through the booking pathway and then drops out is staggering (there will be some valid research-related reasons for these drop-outs, but the volume of traffic starting but not completing this journey indicates a broader, underlying issue) on many of our sites mobile traffic accounted for the majority of entries into the booking pathway, but usually the smallest number of transactions (when traffic was split by device).

2. There is a huge discrepancy in how good ticketing web products are at converting mobile traffic. Arts websites are usually comprised of two main ‘bits’ the ‘content’ side of things (which is what Substrakt build) and the ticketing web product (which we can usually style and implement some basic UX tweaks in, but our options are very limited).

purchase funnel
(an example purchase pathway)

Our clients use a range of ticketing platforms including, but not limited to, Toptix’s eSRO, Tessitura’s TNEW, Spektrix, and Access’s Gamma. When looking at traffic going from clicking a booking button on the ‘content bit’ through to completing a transaction on the ‘ticketing bit’ I was staggered at the divergence in mobile conversion rates. The worst performing system had an average conversion rate of under 3% on mobile whereas the best was converting mobile traffic at an average rate of over 25%. This is a huge difference. For comparison desktop conversion rates ranged from ~19% to ~36%, and tablet from ~15% to ~35%.

What this does show is that some ticketing web products are actually quite successful at converting mobile traffic, and some are not very good at all. The reasons for this quickly become clear when you try to use the various products on a mobile – some aren’t responsive at all and others are but are lumbered with an almost completely baffling user experience.

Hopefully the next wave of updates to these products will see improvements in this area but what these numbers show is that some are failing to achieve their core purpose when it comes to the fastest growing area of web traffic, and that’s a worry.

I thought some supporting context may be helpful.

This shows the growth of mobile traffic (as a proportion of total web traffic), averaged across our clients (over the past 4 years) it also shows the growth of mobile transactions (as a proportion of total web transactions), averaged across our clients over the same time period.

This shows how the proportion of traffic from each device type is changing over time (tablet seems pretty static, whereas the growth of mobile – and the accompanying decline in desktop – is significant).

This last graph shows the split of sales by device, there is far less movement in these splits than we saw in the traffic data.

So what does this tell us?

This isn’t news, but the relentless uptick in mobile traffic looks to continue. Even if this rise begins to stagnate (as tablet traffic has), at current levels it is likely to be almost the largest proportion of traffic to your digital platforms.

I’m sure some people will say that this shows that people research on a mobile before buying on a desktop, which may indeed be the case (and probably is).

But if we accept that as true then that is a slightly precarious position to be in, the number of points of potential failure in your transaction process has just doubled if you’re expecting people to read about your product on one device before completing their transaction on another device.

I’m not convinced this is a particularly optimal user experience either, if this scenario is indeed the case then why aren’t people buying on mobile? I’d suggest it’s because the user experience is often not very good and it’s simply easier to abandon the purchase, or do it on a larger screen, where you have a mouse/trackpad and a keyboard (rather than a small touchscreen).

And lastly are we really willing to think that people ‘just don’t buy’ on mobiles? Because numerous other sectors show that this just isn’t the case.

How can we fix it?

There are likely to be many, many things you can optimise on your website (or at least the bits you have control over), alongside design and layout tweaks we often find that simple changes to language and microcopy can yield significant improvements.

Alongside this I would hope that the ticketing suppliers can begin to improve the web products they offer to the organisations they work with, because some of them are demonstrably underperforming – and that’s not good for anyone, supplier, organisation or customer.

If you’re interested in a free ticket funnel healthcheck then get in touch: team@substrakt.com. All I’d require is access to your analytics and tag manager accounts and I can let you know how you stack up against the benchmarks, and what can be done to improve things.